
For decades, India has relied on the Index of Industrial Production (IIP) to track its industrial health. But here’s the catch: services now make up more than half of India’s economy, and yet no monthly indicator has ever tracked this huge sector the way IIP tracks industry. So, a real gap has existed for years. Finally, though, this gap is closing. The Ministry of Statistics and Programme Implementation (MoSPI) plans to launch the Index of Services Production (ISP) in July 2026.
What Is ISP?
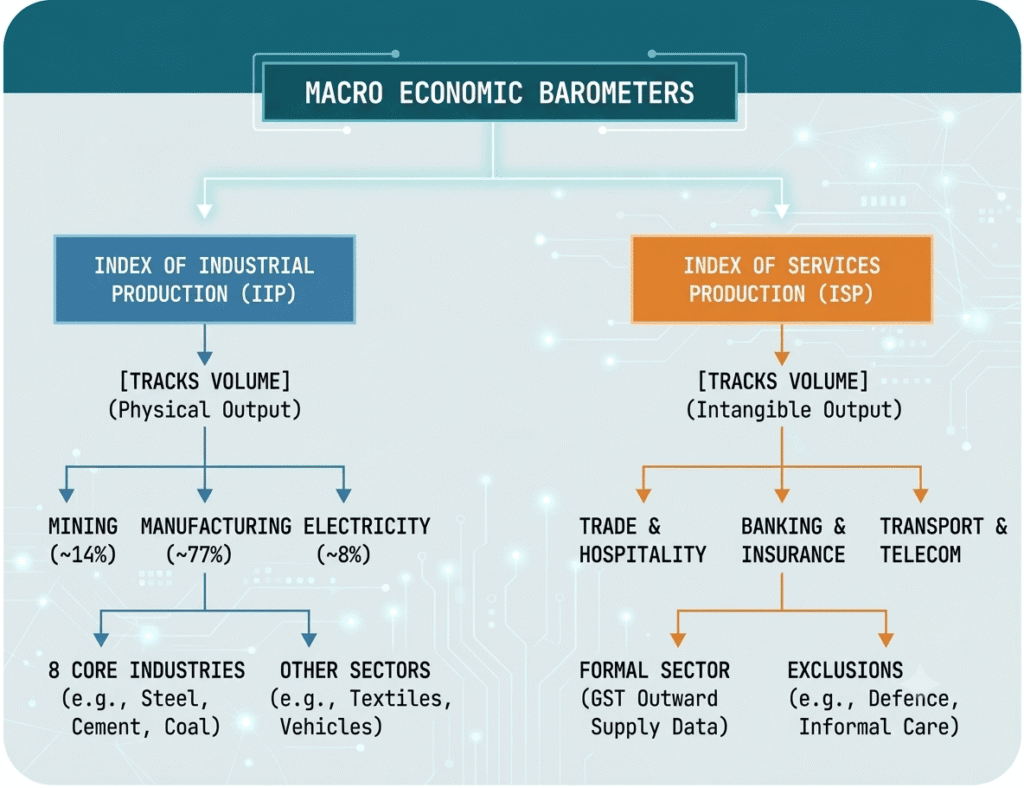
Simply put, the Index of Services Production measures how the services sector’s output changes over time, compared to a fixed base period. In other words, just as IIP shows whether factories produce more or less, ISP will show whether services — banking, transport, telecom, trade, and more — are growing or slowing down each month.
Here are the key facts at a glance:
- Compiled by: Ministry of Statistics and Programme Implementation (MoSPI)
- Acts as a counterpart to: IIP (which covers industry)
- Coverage: Formal services sector only
- Base year: 2024-25
- Frequency: Monthly, with a lag of about 60 days
- First trial release: 14th July 2026 (covering FY 2025-26 and April 2026 data)
Why Does India Need an ISP?
Since the services sector now drives the Indian economy — it has contributed over 50% of Gross Value Added since 2013-14 — policymakers clearly need a fast, monthly pulse-check on this sector too. Until now, however, this pulse-check simply didn’t exist for services the way it did for industry.
So, what are the two main goals behind ISP? They are:
- To provide economic trends that complement IIP, and thereby give a fuller short-term picture of the economy.
- To deliver high-frequency information on services performance, which strengthens the statistical base for policy-making.
Moreover, ISP will help National Accounts statisticians, economic ministries, researchers, and analysts track business cycles more accurately. After all, GDP data arrives only quarterly, while ISP will arrive every month.
Why Couldn’t India Compile This Earlier?
Interestingly, compiling a services index is far harder than compiling IIP, mainly because services are largely intangible. Unlike a factory, which churns out a countable quantity of steel or cement, a bank or a consultancy firm doesn’t produce a “physical unit” that anyone can easily measure.
As a result, India faced three major challenges for years:
- Limited administrative data on service-producing industries
- Highly diverse services, which require different indicators for different sub-sectors
- No suitable price indices to convert value data into real volume data
What Changed? Why Is ISP Possible Now?
Over the last decade, two key developments solved these old problems:
- High-frequency GST data, which now provides monthly information on the outward supplies (sales) of registered service enterprises
- The Annual Survey of Incorporated Services Sector Enterprises (ASISSE), which fills the gap for sectors like Health and Education that fall outside GST
Consequently, MoSPI now has enough reliable data flowing in every month to attempt a trial version of ISP.
Institutional Background
To finalize the ISP framework, MoSPI constituted a Technical Advisory Committee (TAC) in May 2025, chaired by Ms. Debjani Ghosh, Distinguished Fellow at NITI Aayog. Based on the TAC’s deliberations, MoSPI then released an Approach Paper on 27th April 2026 for public feedback. Meanwhile, the final TAC Report is expected in the first fortnight of July 2026.
Coverage of ISP
Sub-Sectors Included
ISP will cover sub-sectors such as wholesale and retail trade, transport, banking, insurance, telecommunications, hotels and restaurants, real estate, professional and scientific services, and arts, entertainment and recreation, among others.
Notably, though, Health and Education services will join later, once ASISSE results become available.
Sub-Sectors Excluded
Since ISP focuses only on the formal, market-driven part of the economy, it leaves out certain activities. These exclusions include:
- Public administration and Defence
- Financial services other than Banking and Insurance (e.g., Central Bank activities)
- Social work activities without accommodation
- Activities of membership organisations
- Personal services
- Activities of private households as employers
- Activities of extraterritorial organisations
- Government-provided Health and Education
- Gambling and betting activities
So, it’s important to note that ISP won’t cover the informal services sector at all, since GST outward-supply data from registered enterprises forms its entire foundation.
How Will ISP Be Compiled?
Data Sources
ISP rests on three main pillars of data:
- Administrative data – for Air Transport, Railway Transport, Banking, and Insurance
- GST data – for most sub-sectors, including trade, hospitality, telecom, real estate, and professional services
- ASISSE data – for Health and Education (non-government)
Quantity-Based vs. Value-Based Indicators
On one hand, quantity-based indicators measure physical output directly, such as passenger-kilometres in Air Transport. Only two sub-sectors — Air Transport and Railways — use this method.
On the other hand, value-based indicators measure output through revenue or turnover. MoSPI prefers this approach for most other sub-sectors, since turnover closely reflects actual production in services (because people consume services almost as soon as providers produce them).
The Role of Deflators
Since turnover data comes in nominal (value) terms, MoSPI must convert it into real (volume) terms by removing the effect of price changes. To do this, it uses a deflator, following this hierarchy:
- WPI for Wholesale Trade
- Sector-specific CPI, wherever available
- CPI General for Banking and Insurance
- CPI Non-Food, for all remaining sub-sectors
Although international best practice prefers Service Producer Price Indices (SPPI) as deflators, India currently has SPPI for only five sectors — Air Transport, Railways, Telecom, Banking, and Insurance. Hence, MoSPI uses CPI as an acceptable proxy, since SPPI and CPI tend to move closely together when people consume services almost immediately after providers produce them.
Why Base Year 2024-25?
MoSPI chose 2024-25 as the base year mainly because it aligns with the new CPI series, which also uses 2024 as its base. This alignment, in turn, ensures that the deflators used in ISP stay methodologically consistent.
Compilation Formula
MoSPI will compile ISP using a fixed-weight Laspeyres volume index, with weights drawn from each sub-sector’s contribution to Gross Value Added (GVA). It chose GVA-based weights because they best reflect each industry’s true economic importance.
ISP vs. IIP: A Quick Comparison
| Feature | IIP | ISP |
|---|---|---|
| Sector covered | Industry (manufacturing, mining, electricity) | Services (formal sector) |
| Released by | NSO (MoSPI) | MoSPI |
| Base year | 2022-23 | 2024-25 |
| Frequency | Monthly | Monthly |
| Release lag | ~6 weeks | ~60 days |
| Main data source | Physical production data | GST outward supplies, administrative data, ASISSE |
| Informal sector | Partially excluded | Fully excluded |
- ISP fills a long-standing data gap in India’s macroeconomic statistics.
- It reflects India’s growing alignment with international statistical best practices.
- This Index will strengthens the evidence-based policy-making ecosystem, especially for RBI’s monetary policy decisions, which currently rely heavily on industrial and price data alone.
- It highlights the rising use of GST data for statistical purposes beyond taxation — a significant innovation in itself.
Likely Prelims-Style Statements (For Practice)
Consider the following statements regarding the Index of Services Production (ISP):
- ISP is released by the Reserve Bank of India. (Incorrect — MoSPI releases it, not RBI)
- The base year of ISP is 2024-25. (Correct)
- ISP fully captures the informal services sector. (Incorrect — it covers only the formal sector)
- ISP uses a fixed-weight Laspeyres volume index for compilation. (Correct)
Ready-Made Statements for Mains Answers
- “The Index of Services Production, which MoSPI will launch, marks a significant step in strengthening India’s short-term macroeconomic statistical framework, since it complements the existing Index of Industrial Production.”
- “Because the services sector contributes over 50% of India’s Gross Value Added, the absence of a monthly services indicator had long remained a critical gap in India’s statistical architecture.”
- “By leveraging high-frequency GST data, ISP shows how digital tax infrastructure can serve statistical and policy innovation too.”
- “Since ISP covers only the formal sector, readers must interpret its findings cautiously, particularly because a large share of India’s services activity remains informal.”
- “The phased inclusion of Health and Education sub-sectors, which depends on ASISSE data, reflects a calibrated and data-driven approach to expanding the index’s coverage.”
- “As India aligns its statistical practices with international standards through indicators like ISP, it strengthens the credibility of its macroeconomic data for global investors and rating agencies.”
These statements fit well into Mains answers on Indian Economy, Government Statistics and Data Governance, Services Sector Growth, and GST as a Statistical Tool.
Conclusion
In summary, the Index of Services Production represents a long-awaited and much-needed addition to India’s economic toolkit. Since it complements IIP and draws upon innovative data sources like GST, it promises to give policymakers a far more complete, monthly picture of the Indian economy. However, because ISP currently excludes the informal sector and parts of Health and Education, its coverage remains a work in progress.

Well explained 👏